
Traditionally, business schools have favored the GMAT over the GRE (the GMAT was designed specifically by the Graduate Management Admission Council for MBA admissions), while PhD or master’s degree programs required GRE scores. Now, however, more and more business schools are accepting both GMAT and GRE scores.
Unfortunately, the firm divisions between the tests means that percentiles aren’t all that useful for GRE to GMAT conversion – the populations taking them are too different.
In this article, we’ll show you how you can convert your GRE score to GMAT score to see how you’ll compare to takers of the the other test. If you’ve already taken one test, you’ll also be able to get an idea how you’d do on the other one.
Feature image credit: Apple puzzle/used under CC BY-SA 2.0/Cropped from original.
GRE to GMAT Conversion Tables
We took ETS’s official GRE conversion information and turned it into charts you can use for GRE to GMAT conversion. All our tables are based on scores calculated using the Excel version of the GRE Comparison tool.
To start with, we have charts that allow you to take your GRE Verbal and Quantitative Reasoning scores and turn them into a total GMAT Score. We also have tables directly comparing the GRE to GMAT Verbal scores and ranges and GRE to GMAT Quantitative scores and ranges.
GRE-GMAT Conversion Chart
Click on the thumbnail below to open the full chart in a new window, or use an abbreviated chart below.
Quick side note: we've created the world's leading online GRE prep program that adapts to you and your strengths and weaknesses. Not sure what to study? Confused by how to improve your score? We give you minute by minute guide.
You don't NEED a prep program to get a great GRE score. But we believe PrepScholar is the best GRE prep program available right now, especially if you find it hard to organize your study schedule and don't know what to study.
Click here to learn how you can improve your GRE score by 7 points, guaranteed.
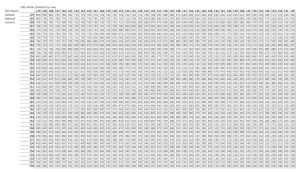
Here’s the abbreviated chart, showing GRE Verbal from left to right, and GRE Quant from top to bottom. Match your two GRE scores, then find your converted GMAT score based on where the row and column intersect.
| GRE Quant (down) | GRE Verbal (right) | ||||||||||||||||||||
| 170 | 168 | 166 | 164 | 162 | 160 | 158 | 156 | 154 | 152 | 150 | 148 | 146 | 144 | 142 | 140 | 138 | 136 | 134 | 132 | 130 | |
| 170 | 800 | 800 | 780 | 770 | 760 | 750 | 730 | 720 | 710 | 700 | 680 | 670 | 660 | 640 | 630 | 620 | 610 | 590 | 580 | 570 | 560 |
| 168 | 790 | 780 | 760 | 750 | 740 | 730 | 710 | 700 | 690 | 670 | 660 | 650 | 640 | 620 | 610 | 600 | 580 | 570 | 560 | 550 | 530 |
| 166 | 770 | 760 | 740 | 730 | 720 | 700 | 690 | 680 | 670 | 650 | 640 | 630 | 610 | 600 | 590 | 580 | 560 | 550 | 540 | 530 | 510 |
| 164 | 750 | 730 | 720 | 710 | 700 | 680 | 670 | 660 | 640 | 630 | 620 | 610 | 590 | 580 | 570 | 560 | 540 | 530 | 520 | 500 | 490 |
| 162 | 730 | 710 | 700 | 690 | 670 | 660 | 650 | 640 | 620 | 610 | 600 | 580 | 570 | 560 | 550 | 530 | 520 | 510 | 500 | 480 | 470 |
| 160 | 700 | 690 | 680 | 670 | 650 | 640 | 630 | 610 | 600 | 590 | 580 | 560 | 550 | 540 | 530 | 510 | 500 | 490 | 470 | 460 | 450 |
| 158 | 680 | 670 | 660 | 640 | 630 | 620 | 610 | 590 | 580 | 570 | 560 | 540 | 530 | 520 | 500 | 490 | 480 | 470 | 450 | 440 | 430 |
| 156 | 660 | 650 | 640 | 620 | 610 | 600 | 590 | 570 | 560 | 550 | 530 | 520 | 510 | 500 | 480 | 470 | 460 | 440 | 430 | 420 | 410 |
| 154 | 640 | 630 | 610 | 600 | 590 | 580 | 560 | 550 | 540 | 530 | 510 | 500 | 490 | 470 | 460 | 450 | 440 | 420 | 410 | 400 | 390 |
| 152 | 620 | 610 | 590 | 580 | 570 | 560 | 540 | 530 | 520 | 500 | 490 | 480 | 470 | 450 | 440 | 430 | 410 | 400 | 390 | 380 | 360 |
| 150 | 600 | 590 | 570 | 560 | 550 | 530 | 520 | 510 | 500 | 480 | 470 | 460 | 440 | 430 | 420 | 410 | 390 | 380 | 370 | 360 | 340 |
| 148 | 580 | 560 | 550 | 540 | 530 | 510 | 500 | 490 | 470 | 460 | 450 | 440 | 420 | 410 | 400 | 390 | 370 | 360 | 350 | 330 | 320 |
| 146 | 560 | 540 | 530 | 520 | 500 | 490 | 480 | 470 | 450 | 440 | 430 | 420 | 400 | 390 | 380 | 360 | 350 | 340 | 330 | 310 | 300 |
| 144 | 530 | 520 | 510 | 500 | 480 | 470 | 460 | 440 | 430 | 420 | 410 | 390 | 380 | 370 | 360 | 340 | 330 | 320 | 300 | 290 | 280 |
| 142 | 510 | 500 | 490 | 470 | 460 | 450 | 440 | 420 | 410 | 400 | 390 | 370 | 360 | 350 | 330 | 320 | 310 | 300 | 280 | 270 | 260 |
| 140 | 490 | 480 | 470 | 450 | 440 | 430 | 420 | 400 | 390 | 380 | 360 | 350 | 340 | 330 | 310 | 300 | 290 | 270 | 260 | 250 | 240 |
| 138 | 470 | 460 | 440 | 430 | 420 | 410 | 390 | 380 | 370 | 360 | 340 | 330 | 320 | 300 | 290 | 280 | 270 | 250 | 240 | 230 | 220 |
| 136 | 450 | 440 | 420 | 410 | 400 | 390 | 370 | 360 | 350 | 330 | 320 | 310 | 300 | 280 | 270 | 260 | 240 | 230 | 220 | 210 | 200 |
| 134 | 430 | 420 | 400 | 390 | 380 | 360 | 350 | 340 | 330 | 310 | 300 | 290 | 270 | 260 | 250 | 240 | 220 | 210 | 200 | 200 | 200 |
| 132 | 410 | 390 | 380 | 370 | 360 | 340 | 330 | 320 | 300 | 290 | 280 | 270 | 250 | 240 | 230 | 220 | 200 | 200 | 200 | 200 | 200 |
| 130 | 390 | 370 | 360 | 350 | 330 | 320 | 310 | 300 | 280 | 270 | 260 | 250 | 230 | 220 | 210 | 200 | 200 | 200 | 200 | 200 | 200 |
This conversion chart is a useful tool if you’ve taken the GRE and are trying to figure out what your equivalent GMAT score would be.
If you want to figure out how you’d do on specific sections of the GMAT, however, you’ll need to use the following section-specific tables.

GRE-GMAT Conversion: Verbal
| GRE Verbal (130-170) | GMAT Verbal (0-60) | GMAT Verbal Range |
| 170 | 46 | 40 – 51 |
| 169 | 45 | 39 – 51 |
| 168 | 44 | 38 – 50 |
| 167 | 43 | 37 – 49 |
| 166 | 42 | 36 – 48 |
| 165 | 41 | 35 – 47 |
| 164 | 40 | 34 – 46 |
| 163 | 39 | 33 – 45 |
| 162 | 38 | 32 – 44 |
| 161 | 37 | 31 – 43 |
| 160 | 36 | 30 – 42 |
| 159 | 35 | 30 – 41 |
| 158 | 35 | 29 – 41 |
| 157 | 34 | 28 – 40 |
| 156 | 33 | 27 – 39 |
| 155 | 32 | 26 – 38 |
| 154 | 31 | 25 – 37 |
| 153 | 30 | 24 – 36 |
| 152 | 29 | 23 – 35 |
| 151 | 28 | 22 – 34 |
| 150 | 27 | 21 – 33 |
| 149 | 26 | 20 – 32 |
| 148 | 25 | 20 – 31 |
| 147 | 25 | 19 – 30 |
| 146 | 24 | 18 – 30 |
| 145 | 23 | 17 – 29 |
| 144 | 22 | 16 – 28 |
| 143 | 21 | 15 – 27 |
| 142 | 20 | 14 – 26 |
| 141 | 19 | 13 – 25 |
| 140 | 18 | 12 – 24 |
| 139 | 17 | 11 – 23 |
| 138 | 16 | 10 – 22 |
| 137 | 15 | 10 – 21 |
| 136 | 15 | 9 – 20 |
| 135 | 14 | 8 – 20 |
| 134 | 13 | 7 – 19 |
| 133 | 12 | 6 – 18 |
| 132 | 11 | 5 – 17 |
| 131 | 10 | 4 – 16 |
| 130 | 9 | 3 – 15 |
ETS suggests that rather than doing a straight score-to-score conversion, the more useful form of GRE / GMAT conversion for Verbal Reasoning is to compare GRE section scores to a range of GMAT subscores. The same holds true for Quantitative Reasoning scores.
GRE-GMAT Conversion: Quantitative
| GRE Quantitative (130-170) | GMAT Quantitative (0-60) | GMAT Quantitative Range |
| 170 | 53 | 47 – 59 |
| 169 | 52 | 46 – 57 |
| 168 | 50 | 45 – 56 |
| 167 | 49 | 44 – 55 |
| 166 | 48 | 42 – 54 |
| 165 | 47 | 41 – 52 |
| 164 | 45 | 40 – 51 |
| 163 | 44 | 39 – 50 |
| 162 | 43 | 37 – 49 |
| 161 | 42 | 36 – 47 |
| 160 | 41 | 35 – 46 |
| 159 | 39 | 34 – 45 |
| 158 | 38 | 32 – 44 |
| 157 | 37 | 31 – 43 |
| 156 | 36 | 30 – 41 |
| 155 | 34 | 29 – 40 |
| 154 | 33 | 27 – 39 |
| 153 | 32 | 26 – 38 |
| 152 | 31 | 25 – 36 |
| 151 | 29 | 24 – 35 |
| 150 | 28 | 22 – 34 |
| 149 | 27 | 21 – 33 |
| 148 | 26 | 20 – 31 |
| 147 | 24 | 19 – 30 |
| 146 | 23 | 17 – 29 |
| 145 | 22 | 16 – 28 |
| 144 | 21 | 15 – 26 |
| 143 | 19 | 14 – 25 |
| 142 | 18 | 12 – 24 |
| 141 | 17 | 11 – 23 |
| 140 | 16 | 10 – 21 |
| 139 | 14 | 9 – 20 |
| 138 | 13 | 7 – 19 |
| 137 | 12 | 6 – 18 |
| 136 | 11 | 5 – 16 |
| 135 | 9 | 4 – 15 |
| 134 | 8 | 2 – 14 |
| 133 | 7 | 1 – 13 |
| 132 | 6 | 0 – 11 |
| 131 | 4 | 0 – 10 |
| 130 | 3 | 0 – 9 |
You can take a look at the specific info behind the statistical analyses used to do the conversions here – ETS is very open about how it came about these results, which is great.
Issues With GRE to GMAT Conversion
The conversion tool ETS has created is not perfect. As ETS states,
*The predicted GMAT scores based on an applicant’s GRE scores may not be perfectly equivalent to an applicant’s actual performance on the GMAT exam due to the measurement error inherent in both tests. For this reason, a predicted score range is reported around each predicted GMAT score.
ETS also takes pains to point out that the group who administers the GMAT, the Graduate Management Admission Council (GMAC), “does not endorse or approve this Comparison tool.” Thus, take any GMAT to GRE conversions with a grain of salt.
High-Level GRE to GMAT Limitations
Because ETS recommends looking at applicants’ Verbal and Quantitative Reasoning GRE scores, while GMAT provides a total score, it’s not really possible to equate the two tests using a traditional “concordance”. There is no “total GRE score” to compare to the total GMAT score, and the GMAT Verbal and Quantitative subscores are scaled to add up to the total GMAT score.
Because of this, it’s not really possible to do any sort of reliable GMAT to GRE conversion; you could try to convert your GMAT section scores to their GRE components, but this will only give you a rough approximation of what you can expect your GRE Verbal and Quantitative Reasoning scores to be (and gives no information about how you’d do on GRE Analytical Writing).
The GMAT is four sections and gives test-takers five scores: total score (200-800), quantitative subscores and quantitative subscores (0-60 each), analytical writing score (0-6), and an integrated reasoning score (1-8). By contrast, the GRE only gives test-takers three scores, one for each section: verbal reasoning (130-170), quantitative reasoning (130-170), and analytical writing (0-6).
Another issue is that the GRE to GMAT score conversion above is based on linear regression of a 472-person size sample population who took both tests within a year’s time of each other “under actual operational, high-stakes conditions.” The data were drawn from real test takers (rather than from a sample study), which calls into question how much the results can be relied upon. Are test-takers who take both the GRE and the GMAT of their own volition really representative of the test-taking populations of the GRE and the GMAT as a whole? Probably not.
ETS acknowledges in its explanation of the GRE conversion tool that the GRE and GMAT testing populations are not the same. More business schools now are also accepting the GRE, and it’s possible there might be more overlap in academic areas closer to business (e.g. industrial psychology, finance), but there’s definitely still two separate spheres of influence for the two tests. For the most part GRE = academic grad school, GMAT = business school.

GRE Conversion Chart Limitations
Even if you score perfect scores on the GRE verbal and quantitative sections, the GRE to GMAT conversion charts predict less than perfect subscores for verbal and quantitative reasoning on the GMAT. Very few people score below a 6 and above a 50 (on a scale of 0-60) on the GMAT subscores (especially on the Verbal Reasoning measure), whereas it is more common for students to max out their Verbal and Quantitative Reasoning scores on the GRE. We’ve created two comparison tables below to show the differences:
Verbal Reasoning Score Percentile Comparison
| Percentile | GMAT (0-60) | GRE (130-170) |
| 99 | 51-60 | 169-170 |
| 0 | 0-6 | 130 |
As you can see, on Verbal Reasoning measures GRE test takers cover pretty much the whole range of scores (0% get a 130 while 1% or fewer get a 169-170), while the GMAT scores are much more condensed (0% get a 0-6 while 1% or fewer get a 51-60). The difference is also apparent (albeit marginally less stark) with the Quantitative Reasoning percentiles:
Quantitative Reasoning Score Percentile Comparison
| Percentile | GMAT (0-60) | GRE (130-170) |
| 97 | 51 | 170 |
| 0 | 6 | 132 |
The difference in the distribution of score percentiles between the GRE and GMAT highlights a difference between the two tests: the GMAT is much more finely tuned to pick up differences in ability at the higher and lower ends of the scale, while the GRE likely allows for more discrimination between middle-level test-takers.
All this goes to show that the GRE and GMAT aren’t just different brands of the same test – the two measures are structurally different in meaningful ways that make comparing scores from the GRE and the GMAT tricky.
As an applicant, this matters to you because business schools that accept both the GRE and GMAT will likely have different standards for each test. These standards won’t necessarily be based around the GRE conversion chart because schools can also draw on institutional knowledge about the scores of admitted students and their subsequent performance in business school.
As a rule of thumb, the longer a business school has been accepting both GRE and GMAT scores, the more likely it is they have concrete standards for both tests, whereas business schools that more recently started accepting GRE scores will be using GRE to GMAT conversion charts to assess applicant performance.

Next Steps: Deciding the Best Test for You
Follow these three steps to make the best decision about which test to take or which scores to submit:
Want to improve your GRE score by 7 points? We have the industry's leading GRE prep program. Built by world-class instructors with 99th percentile GRE scores, the program learns your strengths and weaknesses through machine learning data science, then customizes your prep program to you so you get the most effective prep possible.
Try our 5-day full access trial for free:
- Use these charts to get a rough idea of how your GRE score compares to GMAT scores. Even business schools that now also accept the general GRE, like UPenn’s Wharton School, will often list only GMAT scores in their school profile, so to find out how you stack up against other applicants you’ll need to convert your GRE score into a GMAT score.
- You should also ask individual business schools about their GRE statistics and standards if the standards are not published online/publicly available.
- If you have both GRE and GMAT scores, you can use the GRE conversion charts to assess which score is “better” and so which score to submit to schools.
What’s Next?
What if you took the old, out-of-800 GRE? Find out how to convert your old GRE score to a new GRE score here.
Confused about the content differences between the GRE and GMAT? Learn more about how the two tests compare, plus more details about what’s on the GRE and the GRE format.
What’s a good GRE score? We cover the highest and lowest possible GRE scores and how to use this information.
Ready to improve your GRE score by 7 points?
We've written a eBook about the top 5 strategies you must be using to have a shot at improving your GRE score.
Download it for free now: